Intervention on continuous variable
Case study
You've been wearing your Fitbit for about 3 months, and have noticed that your daily steps are lower than those of your friends. Your best friend noted that there's an herbal supplement she recently began taking that she believes has improved her overall activity, and suggested that you try it out. How do you figure out if it is making a difference?
Category: assessment of intervention on a continuous variable
There are hundreds of examples of situations in which we have the ability to collect data for a continuous measure to determine if an intervention made a difference, but instead resort to convenience methods such as cross-sectional assessment or gestalt. Every day, doctors check their patients' blood pressures in the office, note that it is elevated, start a medication, and then simply wait a few months before rechecking on the next visit, at which point they decide whether the medication is working, or if a higher dose is needed based on the single follow-up value. For motivated patients, who check their pressures at home daily using an automated cuff, the list of blood pressures they show to their doctor is glanced over, with some note of the high and low values, but ultimately what would otherwise be a quantifiable measure is managed qualitatively. This situation is unacceptable. In this section, we assess the various approaches to analysis of intervention on a continuous variable, and describe some of the strengths and weaknesses of each approach.
In this section, we will apply these approaches to a time series obtained from a wearable activity monitor (Fitbit). The data was collected over several months, and includes information about minutes of various activity and steps (of course). If you have a Fitbit device, this data can be directly downloaded from your dashboard (Here's how). Below is a graph created from our code of our sample dataset. In this section, we'll be asking the question, "How can we tell if an intervention, for example starting a daily exercise routine, is having a significant impact on a continuous outcome, in this case the number of steps each day?" For each of the proposed approaches, we'll want to know the following information: 1) Is there a significant (statistically) difference in the outcome before and after the intervention?, 2) Do we have enough information (i.e., power) to make an assessment?, and 3) Are there any assumptions or potential bias in our approach?. For more information about these questions, see Criteria.
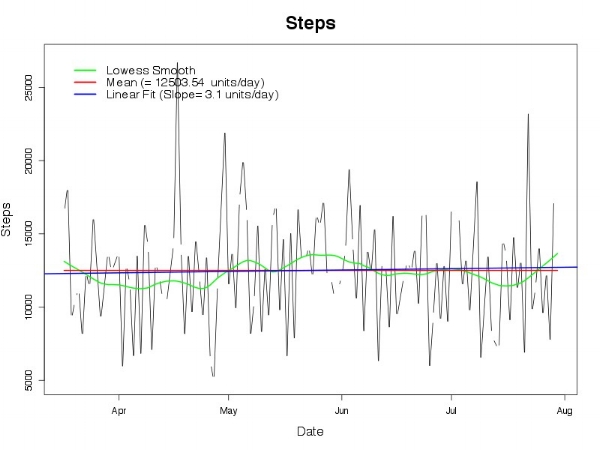
Example of daily steps obtained from a Fitbit device over a period of 5 months. Shown are the actual number of steps per day, the linear trend, the mean steps, and the lowess smooth (local trend). Code for this graph is available on Github.
Approaches
1) Basic: For any given time point of intervention (T), compare the mean value of the outcome (Y) before and after using standard approaches (e.g., t test)
2) ARMAX: Model the outcome (Y) as a time series with the intervention coded as an indicator value (0, 1)
3) Forecast: Model the outcome (Y) as a time series until time T, with forecasted value of Y beyond. Compare actual values of Y with forecasted distribution.